

If you’ve ever watched a drone fly over a rooftop or a plot of land and then, a few days later, received a 3D model you could rotate on your screen, you’ve probably had one of two reactions: “cool, looks just like Google Earth,” or “wait, what am I actually looking at?”
At Render-a, we hear the first reaction from almost every new client, and it’s the reaction we spend the most time correcting. Because what you’re looking at is not a picture. It’s data.
The Misconception We Hear Every Single Time
Most people assume that flying a drone over a site and generating a 3D scan produces something like a video game render or a Google Earth tile: a nice-looking visual maquette and nothing more. They completely miss the massive layer of data sitting underneath it.
To break that assumption, we usually walk clients through three things.
It’s Not Pixels, It’s Coordinates
What you see on screen isn’t a photo or a video. It’s a mathematical, 1:1-scale copy of the real world, a digital twin. Every single point you see in that point cloud has a real-world X, Y, and Z coordinate, accurate to millimeter-level, DIN-standard precision.
You Can Measure and Process Inside It
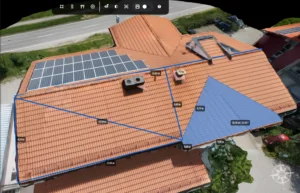
This is usually the moment clients are genuinely surprised. They assume they can only look at the model from the outside, like a photo. In reality, you can go inside the model and pull centimeter-accurate roof pitch angles, measure the exact distance between two walls, or extract a millimeter-precise facade slope. You can see this in practice on our facade measurement and drone roof survey pages, where the same principle applies to entire buildings.
It’s Not a Website Graphic, It’s Engineering Input
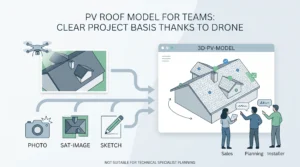
Clients tend to assume the 3D model is just a nice visual that spins around on a website. What they don’t immediately realize is that the data Render-a produces feeds directly into heavy engineering software such as AutoCAD, PVSOL, or PVsyst as a seamless working base layer. It’s not decoration. It’s the foundation the next stage of engineering is built on.
So What’s Actually Happening Behind the Scenes?
It’s worth being precise about the terminology here. What we’re describing isn’t really “3D scanning software” in the sense people usually imagine. It’s photogrammetry.
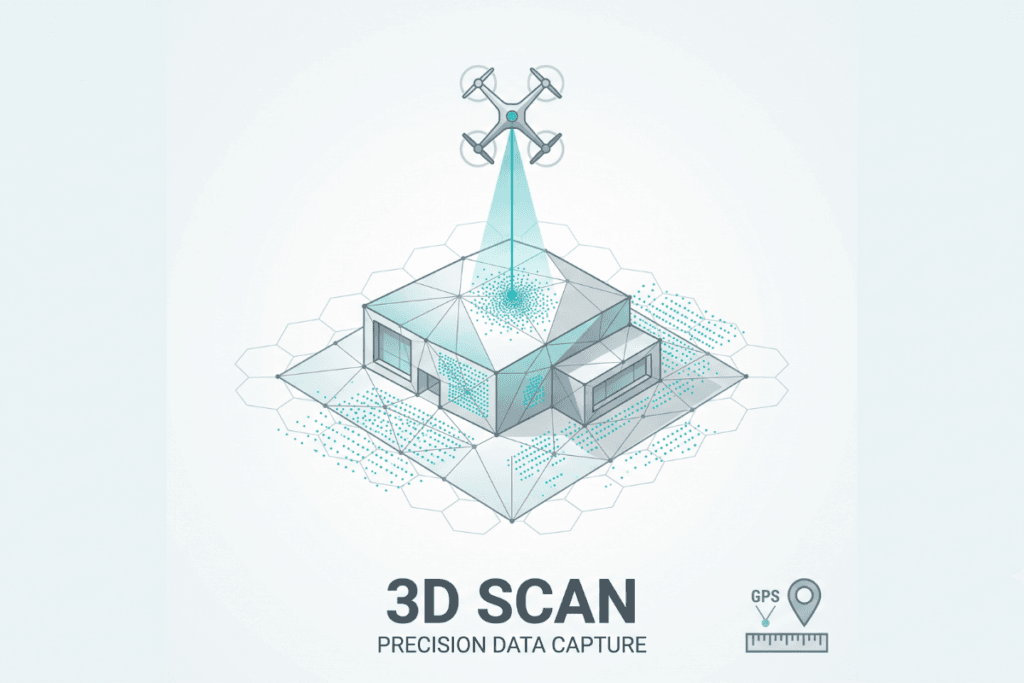
The process starts with the drone capturing overlapping photographs of the site, typically with 70 to 80 percent overlap between shots. That heavy overlap is what allows the software to detect the geometry of an object by comparing how it appears from many slightly different angles, the same principle your two eyes use for depth perception, just automated across hundreds of images.
From there, GPS data tied to each shot is processed to give the resulting point cloud accurate real-world scale. The output isn’t a single photo stitched into a panorama. It’s a georeferenced, coordinate-accurate 3D dataset built from the geometric relationships between hundreds of overlapping images, whether the target is a rooftop, a facade, or an entire plot of land in a 3D land survey.
Where This Actually Pays Off: EPC Teams
The clearest place we’ve seen this matter in practice is with EPC firms, meaning engineering, procurement, and construction teams. When their project engineers have a 1:1 accurate model to design directly on top of, they can draw their project plans against real, verified geometry instead of approximate site measurements.
The practical result is installations that go right the first time, without the revision cycles that usually stretch a project out. There’s no re-measuring on site after the design is already drawn up, and no surprises during installation because a wall turned out to be off from what someone eyeballed months earlier. One accurate model, one design pass, one installation.
If you want to see the full range of what this looks like across use cases, our 3D modeling solutions overview covers how the same underlying process supports different project types.
Where This Is Headed
Beyond solar, which is where Render-a has focused so far, the same underlying process opens up to LiDAR data and product modeling more broadly.
The bigger shift isn’t really about the modeling technology getting flashier. It’s about how much manual workload disappears. Buildings and terrain that used to be difficult or slow to access and measure become reachable and measurable with a single drone flight. That’s the real story: not a fancier-looking model, but hours of manual measurement work replaced by one flight and one processing pipeline.